[Week 03] Lectures
[33 data loading]
<read.csv>
# Import swimming_pools.csv: pools
pools <- read.csv('swimming_pools.csv')
# Print the structure of pools
str(pools)
# $ Name : Factor
# $ Address : Factor
# read.csv를 해서 파일을 import 하면 character column은 Factor로 인식한다.
# 그래서 Factor로 변경되기 원하지 않는다면 아래와 같이 parameter를 추가할 수 있다.
pools <- read.csv('swimming_pools.csv', stringAsFactors = FALSE)
str(pools)
# $ Name : chr
# $ Address : chr
# 파일을 import 할 때 read.csv 안에서 stringAsFactors를 FALSE로 해서 character column을 그대로 가져 올 수 있지만,
# 파일을 불러 온 이후에 변경하는 방법도 있다.
pools <- read.csv('swimming_pools.csv')
pools$Name <- as.character(pools$Name)
pools$Address <- as.character(pools$Address)
str(pools)
# $ Name : chr
# $ Address : chr
# read.table
# csv 파일 외 txt 파일을 읽어 올 때 read.table이 쓰인다. (csv 파일도 불러올 수 있다)
# ex) read.table("state2.txt", header = TRUE, sep ="/", stringAsFactors = FALSE)
# reading hotdog.txt
hotdogs <- read.table('hotdogs.txt', sep='\t')
# Call head() on hotdogs
head(hotdogs)
# 파일을 불러 올 때 칼럼 이름을 설정할 수 있다
hotdogs <- read.table('hotdogs.txt', sep='\t', col.names = c('type', 'calories', 'sodium'))
head(hotdogs)
# add new variable named 'cal.type'
# 위에서 생성된 hotdogs 데이터프레임에 새로운 열 추가하기
hotdogs$cal.type <- ifelse(hotdogs$calories >= 150, 'heavy', 'light')
head(hotdogs)
# type calories sodium cal.type
# 1 Beef 186 495 heavy
# 2 Beef 181 477 heavy
write.csv(hotdogs, file = 'newhotdog.csv', row.names = F)
write.table(hotdogs, file = 'newhotdogs.tsv', row.names = F, sep = '\t')
# 변수들 RData로 저장하기
# 나중에 저장된 변수들을 불러와서 새로 생성할 필요 없음
v1 <- 10
v2 <- c(1, 2, 3, 5)
v3 <- matrix(1:9, nrow = 3)
save(v1, v2, v3, file = 'mywork.RData')
# 변수 파일 불러오기
# load.('mywork.RData')
[34 apply functions]
apply(X, MARGIN, FUN, ...)
- X is matrix or dataframe
- MARGNI is a variable defining how the function is applied:
-- MARGIN = 1, it applies over rows
-- MARGNI = 2, it works over columns
- FUN is the function that you want to apply to the data
# 예시
my_mat <- matrix(1:6, nrow = 3, byrow = T)
# 열의 평균을 계산해서 벡터로 반환하기
apply(my_mat, 1, mean)
[1] 1.5 3.5 5.5
# 행의 평균을 계산해서 벡터로 반환하기
apply(my_mat, 2, mean)
[1] 3 4
# 랜덤 변수 만들기
# runif(12)의 의미는 0부터 1까지 랜덤한 소수를 12개 만들겠다.
set.seed(2018)
myMat <- matrix(runif(12), ncol = 4)

apply(myMat, 1, mean)

apply(myMat, 2, mean)

# apply() 두 번째 예시
# 아이리스 데이터셋 모든 행, 1열-4열까지의 열 별 평균을 구하고 벡터로 반환한다.
apply(iris[, 1:4], 2, mean)

# 아이리스 데이터셋 모든 행, 1열-4열까지의 행 별 평균을 구하고 벡터로 반환한다.
apply(iris[, 1:4], 1, mean)

# 벡터로 반환하지 않는 colMeans
colMeans(iris[, 1:4])

# lapply()
- It applies function to dataframes, lists or vectors
- It gives you back a list
myList <- list(num = 3.14, chr = 'char', logi = TRUE)
myList

# lappy는 단순히 (dataframe, 함수)
lapply(myList, typeof)

lapply()
myList2 <- list(vec = 1:5, mat = matrix(runif(12), ncol = 4, df = iris)
result <- lapply(myList2, length) # 리스트의 엘리먼트 별 길이를 리스트로 반환
result
# $vec
# [1] 5 # number of elements
# $mat
# [1] 12 # number of elements
# $df
# [1] 5 # number of columns
unlist(result) # list -> vector
## vec mat df
## 5 12 5
# lapply 예시
lapply(c(1, 4, 9, 16), sqrt)

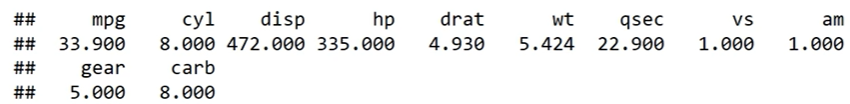
lapply(mtcars, max)

unlist(lapply(mtcars, max))
sapply()
- It applies function to dataframes, lists or vectors.
- It gives you back a vector or matrix.
sapply(iris[, 1:4], mean)

sapply(iris, is.numeric)

sapply(c(1,3,5,7,9), function(x) {x ** 2})
## [1] 1 9 25 49 81
# sapply() 예시
myMat <- matrix(1:12, ncol = 4)
sapply(myMat, function(x) {x/2})
## [1] 0.5 1.0 1.5 2.0 2.5 3.0 3.5 4.0 4.5 5.0 5.5 6.0
sapply(pools, typeof)
## Name Address Latitude Longitude
## 'character' 'character' 'double' 'double'
x <- sapply(iris[, 1:4], function(x) { x > 3})
head(x)
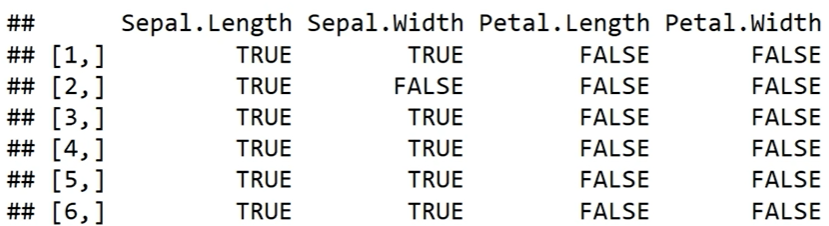
colSums(x)

tapply()
- tapply(X, GRP_VAR, FUN, ...)
-- apply FUN to X after grouping with GRP_VAR
-- It returns as vector,
tapply(iris$Sepal.Length, iris$Species, mean)

tapply(iris$Sepal.Length, iris$Species, mean)

tapply(iris$Sepal.Length, iris$Species, mean)

# cyl 실린더로 mpg를 그룹화 하여 함수 적용
x <- tapply(mtcars$mpg, mtcars$cyl, function(x) {x>20})
x

# 실리더 4개 짜리로 그룹화 한 mpg들에 함수 적용 결과
# 실리더 6개 짜리로 그룹화 한 mpg들에 함수 적용 결과
# 실리더 8개 짜리로 그룹화 한 mpg들에 함수 적용 결과
sapply(x, sum)
## 4 6 8
## 11 3 0
[35 aggre order]
aggregate()
aggregate(var1 ~ var2, data = X, FUN = func, ... )
- Apply func to var1 of X after grouping by var2
- Alternates to tapply
- Result is data.frame
# 실린더의 개수로 mpg를 그룹화하여서, 평균 함수를 적용한다. 결과는 데이터 프레임.
aggregate(mpg ~ cyl, data = mtcars, FUN = mean)

# Species 종류 개수로 Length를 길이를 그룹화해서, 평균 함수를 적용한다. 결과는 데이터 프레임.
aggregate(Sepal.Length ~ Species, data = iris, FUN = mean)

# Order() and sort()
- order() gives a vector of index of smallest element, second smallest, .. , the largest element
- sort() gives a sorted vector of numbers
- decreasing option to have result in descending order
# order는 순위를 벡터로 반환
my_vector <- c(6, 12, 4, 89, 23, 35)
order(my_vector)
## [1] 3 1 2 5 6 4
my_vector[order(my_vector)]
## [1] 4 6 12 23 35 89
# sort는 벡터를 오름차순/내림차순으로 정렬
sort(my_vecotr)
my_vector[order(my_vecotr, decreasing = T)]
## [1] 89 35 23 12 6 4
sort(my_vector, decreasing = T)
## [1] 89 35 23 12 6 4
# mpg를 기준으로 내림차순 정렬
mtcars[order(mtcars$mpg, decreasing = T), ]

'공부 > R Programming' 카테고리의 다른 글
| [Week 06] Lectures (0) | 2021.04.09 |
|---|---|
| [Week 04] Lectures (0) | 2021.03.28 |
| Data Science Week 03 - 02 (0) | 2021.03.19 |
| Data Science Week 03 - 01 (0) | 2021.03.18 |
| Week 01: Basics of R (0) | 2021.03.02 |


댓글