반응형
Matplotlib 애니메이션으로 Linear Regression 표현하기
1) x, y축에 하나씩 점 찍기

|
1
2
3
4
5
6
7
8
9
10
11
12
13
14
15
16
17
18
19
20
21
22
23
|
import matplotlib.pyplot as plt
import numpy as np
from sklearn.linear_model import LinearRegression
import random
x_values = []
y_values = []
for _ in range(1000): # 점의 개수
x_values.append(random.randint(0, 100)) # x축 값
y_values.append(random.randint(0, 100)) # y축 값
plt.xlim(0, 100)
plt.ylim(0, 100)
plt.scatter(x_values, y_values, color='black') # 점의 색깔
plt.pause(0.0001) # 점이 한 번 찍히고 다음에 점이 찍히기 까지의 시간
plt.show()
|
cs |
2) x, y축에 한 번에 여러 점 찍기

|
1
2
3
4
5
6
7
8
9
10
11
12
13
14
15
16
17
18
19
20
21
22
|
import matplotlib.pyplot as plt
import numpy as np
from sklearn.linear_model import LinearRegression
import random
x_values = []
y_values = []
for _ in range(1000): # 점의 개수
x_values.append(random.randint(0, 100)) # x축 값
y_values.append(random.randint(0, 100)) # y축 값
# 10개를 한 번에 찍기
if _ % 10 == 0:
plt.xlim(0, 100)
plt.ylim(0, 100)
plt.scatter(x_values, y_values, color='black') # 점의 색깔
plt.pause(0.001) # 점이 한 번 찍히고 다음에 점이 찍히기 까지의 시간
plt.show()
|
cs |
3) x,y축 위 랜덤 점 위에 선형 회귀 그리기

|
1
2
3
4
5
6
7
8
9
10
11
12
13
14
15
16
17
18
19
20
21
22
23
24
25
26
27
28
29
30
31
|
import matplotlib.pyplot as plt
import numpy as np
from sklearn.linear_model import LinearRegression
import random
reg = LinearRegression()
x_values = []
y_values = []
for i in range(1000):
x_values.append(random.randint(0, 100))
y_values.append(random.randint(0, 100))
x = np.array(x_values)
x = x.reshape(-1, 1)
y = np.array(y_values)
y = y.reshape(-1, 1)
# 5개 씩 찍기
if i % 5 == 0:
reg.fit(x, y)
plt.xlim(0, 100)
plt.ylim(0, 100)
plt.scatter(x_values, y_values, color='gray')
plt.plot(list(range(100)), reg.predict(np.array([x for x in range(100)]).reshape(-1,1)))
plt.pause(0.001)
plt.show()
|
cs |
4) 랜덤 막대 그래프 그리기

|
1
2
3
4
5
6
7
8
9
10
11
12
13
14
15
|
import matplotlib.pyplot as plt
import random
# 막대 그래프의 개수
values = [0] * 100
for i in range(100):
values[i] = random.randint(0, 200) # y 값 0에서부터 199까지 랜덤 난수 생성
plt.xlim(0, 100)
plt.ylim(0, 200)
plt.bar(list(range(100)), values)
plt.pause(0.0001)
plt.show()
|
cs |
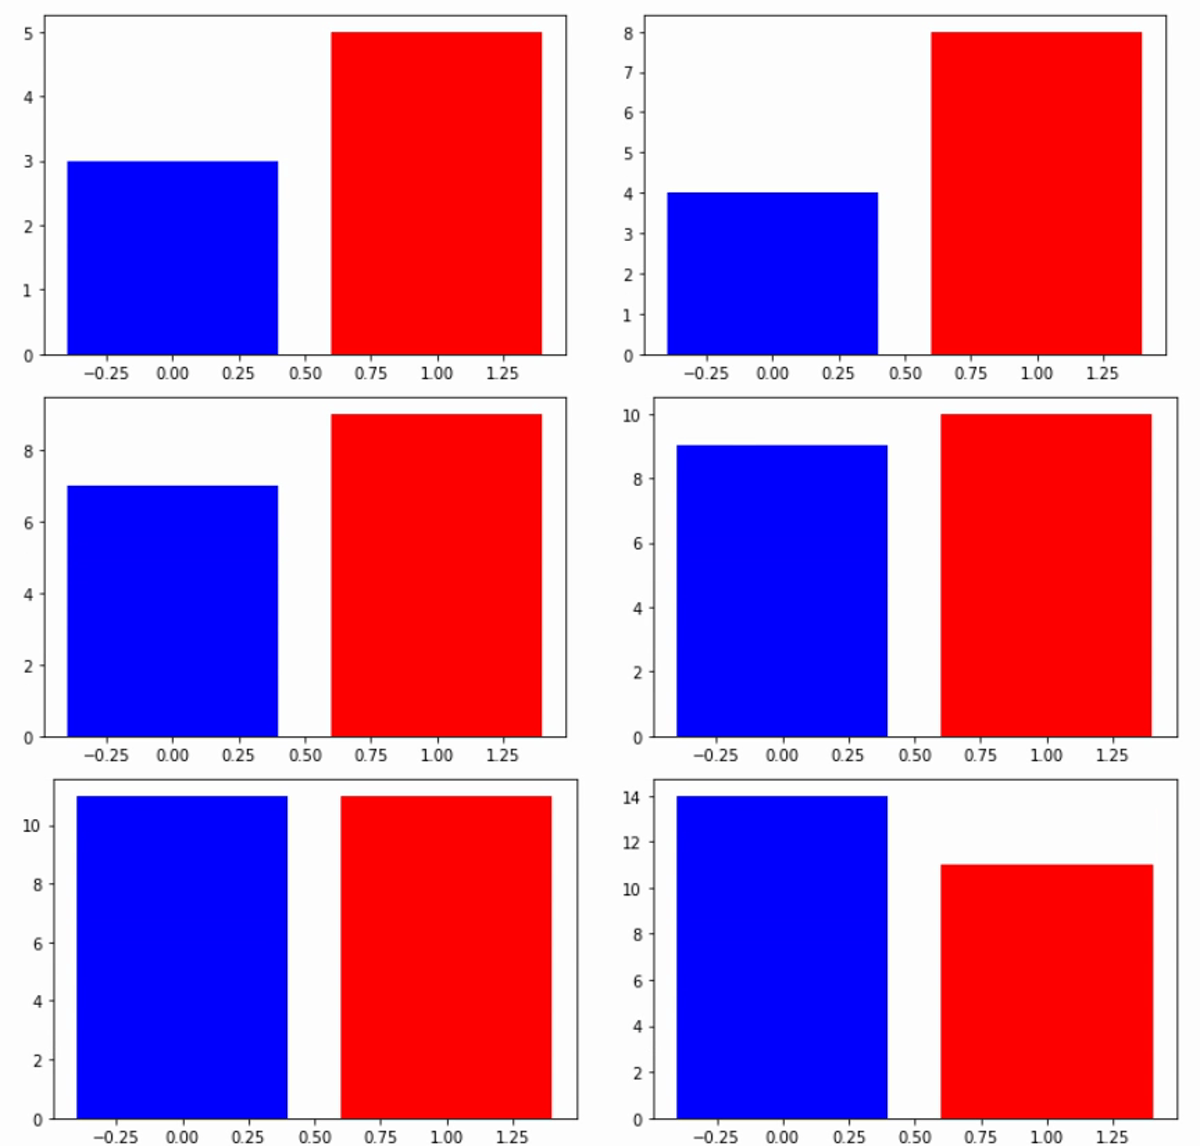
5) 코인 플립 막대 그래프로 나타내기
Flipping Heads and Tails into Animation

|
1
2
3
4
5
6
7
8
9
10
11
12
13
14
|
# head / tail coin
import matplotlib.pyplot as plt
import random
heads_tails = [0, 0]
for _ in range(100000):
if _%50==0:
heads_tails[random.randint(0, 1)] += 1
plt.bar([0,1], heads_tails, color=("blue", "red"))
plt.pause(0.001)
plt.show()
|
cs |
Matplotlib Animation 만들기 끝.
반응형
'공부 > 파이썬 Python' 카테고리의 다른 글
| Python 3D 플로팅 연습하기 (0) | 2022.01.04 |
|---|---|
| Python에서 나만의 HTTP Server 만들기 (0) | 2022.01.03 |
| Python으로 캔들스틱 주가 시각화하기 (0) | 2021.12.21 |
| Google Colab에서 오디오북 리더 만들기 (feat. Python) (3) | 2021.12.20 |
| 정렬 알고리즘 시각화하기 (0) | 2021.12.19 |


댓글